
Chapter 1 of 12
Generations Arriving at the Front Door
Why so many first-time buyers are still waiting for a home of their own.
Jump to a page on the report 1-59 + 37A-37C
The online edition groups several PDF pages into each chapter. Select a page to open its place in the web edition. Pages 1 and 2 correspond to the cover and contents on the research home page. The revised PDF adds Chapter 7 pages 37A-37C while retaining the original page numbers.
A New Generation Is Ready for a Place of Its Own
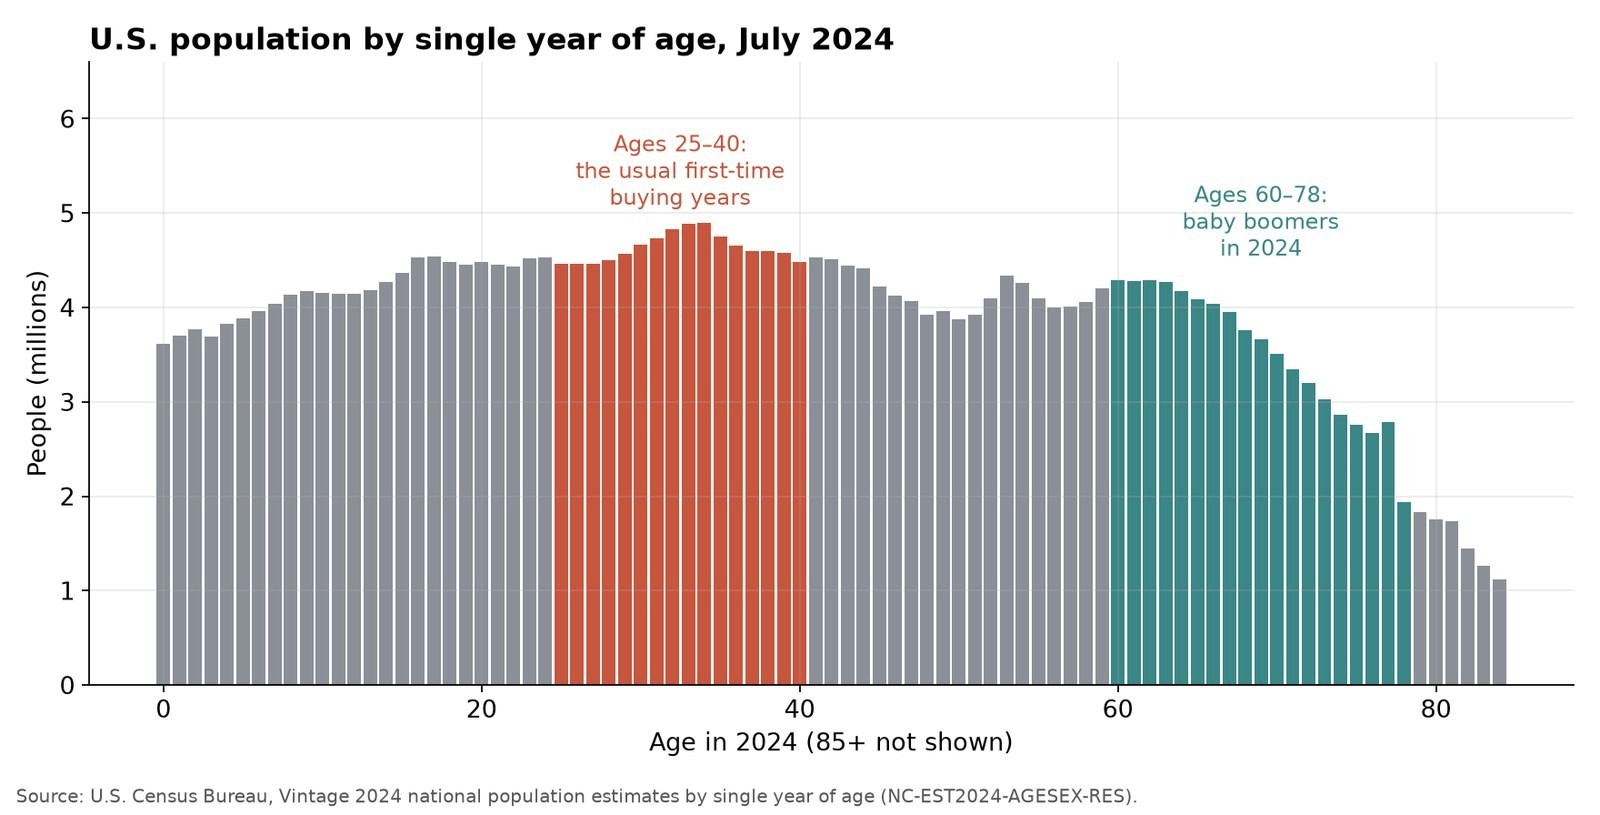
The United States is facing a mismatch between the generations seeking homes and the homes available to them. Census Bureau Vintage 2024 estimates counted 74.1 million residents ages 25 to 40, compared with 65.7 million ages 10 to 24 and 66.9 million ages 60 to 78. Age 34 was the largest single-year age group nationally. These are people, not prospective-buyer households, and the age bands have different widths. [16]
 Select the figure for a larger view
Figure 2. U.S. population by single year of age in July 2024. Age 34 was the largest single-year group in the supplied Census-based exhibit. The highlighted age bands have different widths. Population is not a count of mortgage-ready households.
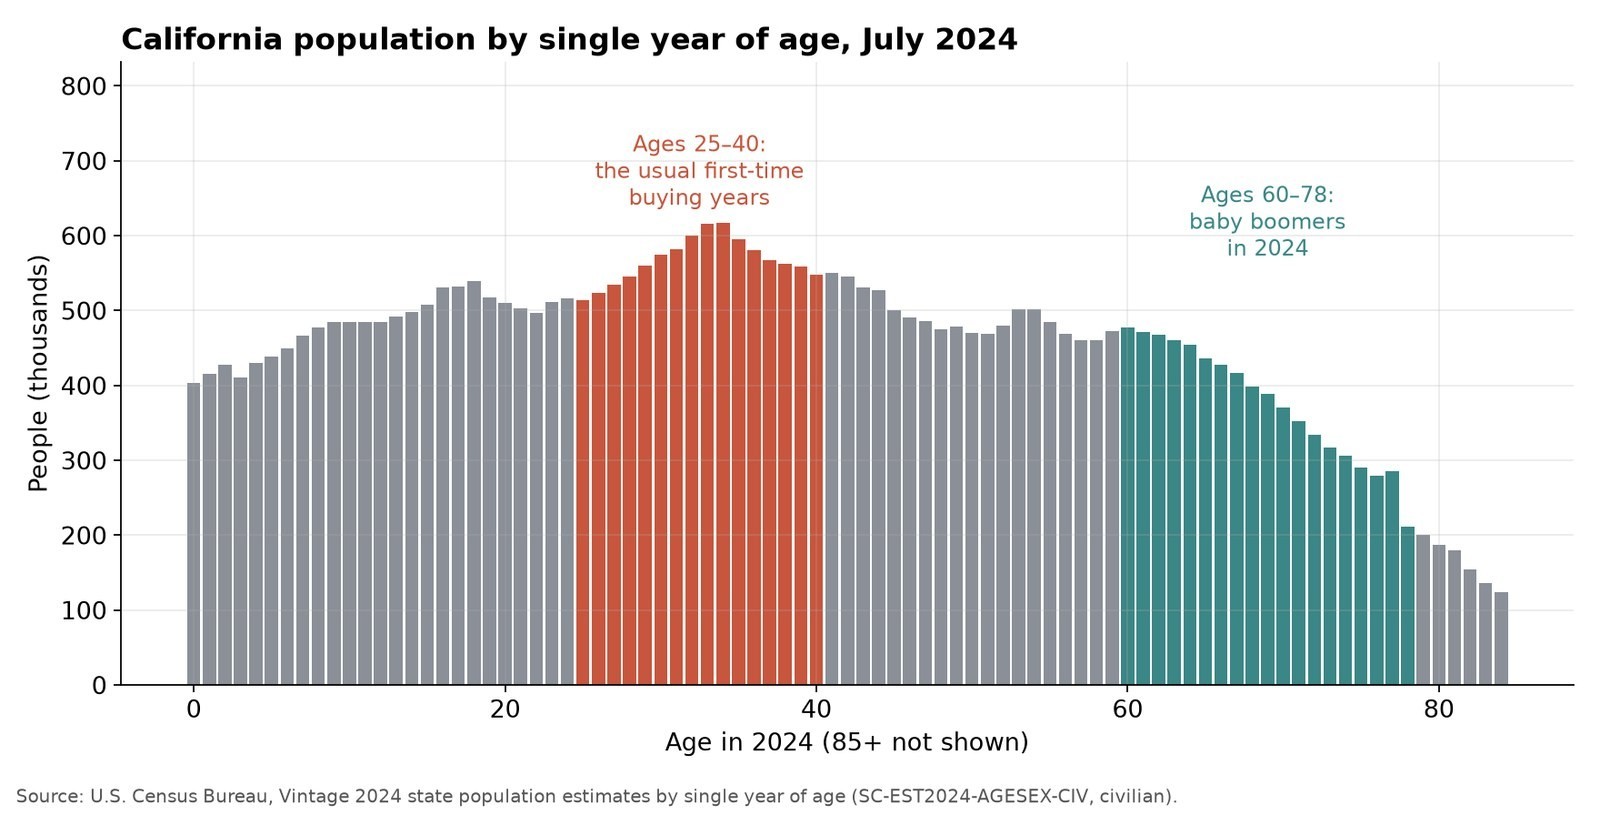
California’s civilian population included 9.08 million people ages 25 to 40 and 7.14 million ages 60 to 78. Its largest individual age group was also 34, excluding the grouped category for ages 85 and older. Many people in these cohorts are forming households or considering their first purchase. Migration, marriage, shared living, income, credit, and preferences determine how many become buyers. [17]
 Select the figure for a larger view
Figure 3. California civilian population by single year of age in July 2024. Ages 85 and older are omitted. Civilian population; unequal age-band widths. The national chart uses resident population.
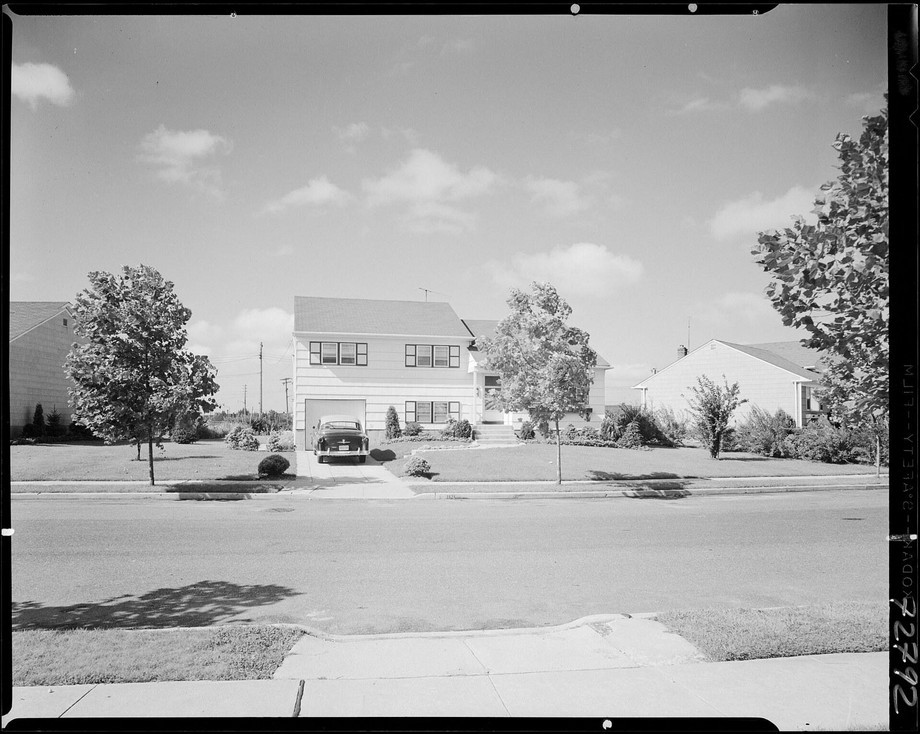
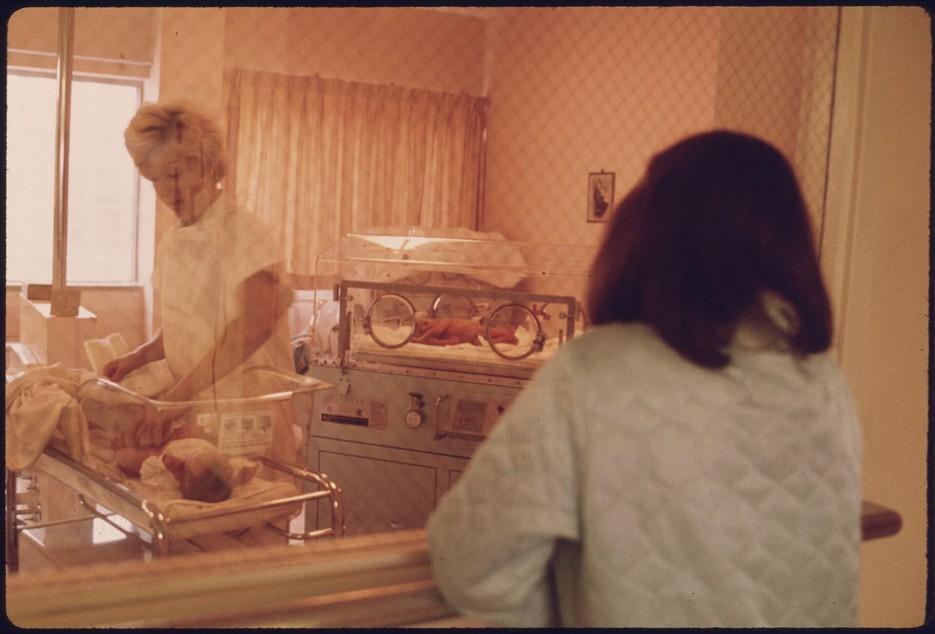
The birth record explains part of this demographic shape. U.S. births declined from about 4.3 million in 1957 to 3.14 million in 1973 and 3.16 million in 1974, then rose to 4.16 million in 1990 and 4.32 million in 2007. Final 2024 data record 3.63 million births. The smaller cohorts born in the early 1970s reached their thirties near the housing bubble, while the larger 1990 cohort reached age 34 in 2024. [18, 19]
 Select the figure for a larger view
 Select the figure for a larger view
Figures 4 and 5. Left: A new mother views her child in the nursery of Loretto Hospital in New Ulm, Minnesota, October 1974. Right: Levittown houses photographed in 1958.
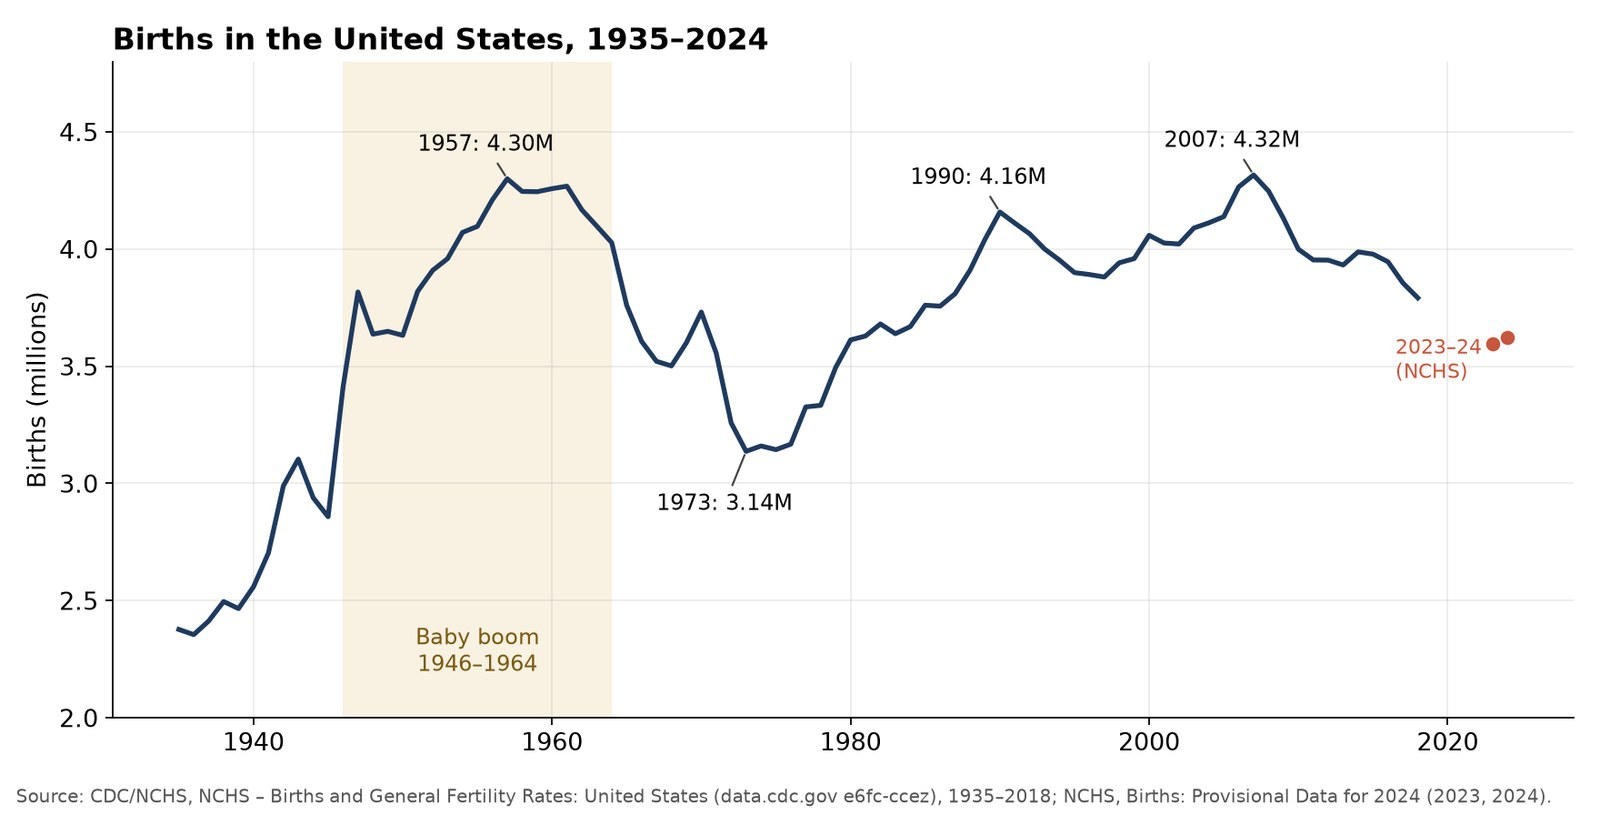 Select the figure for a larger view
Figure 6. U.S. births from 1935 through 2024, reproduced from the source paper. The exhibit omits annual observations for 2019-2022 and labels 2023-2024 provisional. The source chart omits 2019-2022. Final 2024 NCHS births are 3,628,934 (3.63 million), replacing the provisional endpoint shown. [18]
The earlier paper raises a hypothesis that the smaller early-1970s cohorts weakened the entry-buyer pipeline near the 2008 crash. The birth counts establish the cohort difference, but they do not isolate a contribution to the crash. Migration, lending standards, leverage, speculative demand, and prices also shaped that period. Demography is a long-run demand input, not a complete explanation of a financial crisis.
The smaller cohorts now behind the Millennial generation may eventually ease some demand pressure. That possibility does not provide an immediate home for households waiting today. Nor does slower population growth eliminate an accumulated shortage or ensure homes are available in the right locations.
What Today’s Buyer Numbers Tell Us About the Wait
NAR’s 2025 survey estimated that first-time buyers accounted for 21% of primary-residence purchases from July 2024 through June 2025, with a median first-time buyer age of 40. The estimate includes cash purchases of primary residences and comes from a survey of successful buyers. It does not describe all households, all mortgage borrowers, or everyone who wanted to buy. [20]
Zillow’s 2025 buyer survey estimated a 45% first-time share using a different online sampling method and a two-year purchase window. Its 2026 report estimated 42%, while the published methodology described a one-year purchase window. The different sampling and reference periods prevent treating these numbers as interchangeable observations or a clean unified trend. [21, 22]
Why First-Time Buyer Surveys Can Show Different Shares
| Source | Estimate | Population and reference period |
|---|---|---|
| NAR 2025 profile | 21%; median age 40 | Surveyed primary-residence purchases, July 2024-June 2025; includes cash |
| Zillow 2025 report | 45% | Online sample of successful primary-residence buyers over prior two years |
| Zillow 2026 report | 42% | Online successful-buyer sample; published methodology uses prior year |
Survey results are not a census of transactions or of financially ready renters. Different sampling and recall periods limit direct comparisons. [20, 21, 22]
The discrepancy is substantive. It cannot be resolved by selecting the most dramatic number. Both surveys face sampling and response issues, and loan datasets introduce other restrictions by excluding cash transactions or including a borrower who has not owned for three years within a program’s first-time definition.
The defensible conclusion is that entering ownership has become difficult for many households, supported by direct affordability and supply evidence. The exact national share of first-time buyers depends on the definition and measurement method. For program evaluation, the more useful questions are how many eligible households seek assistance, how many complete purchases, and how many remain financially secure.
Prefer the original layout? Open this section in the PDF →