
Chapter 4 of 12
What Homeownership Can Give You, and What It Can Cost
Read the tradeoffs behind equity, leverage, transaction costs, and the decision to rent or buy.
Jump to a page on the report 1-59 + 37A-37C
The online edition groups several PDF pages into each chapter. Select a page to open its place in the web edition. Pages 1 and 2 correspond to the cover and contents on the research home page. The revised PDF adds Chapter 7 pages 37A-37C while retaining the original page numbers.
How a Home Can Help Build Wealth, and Where the Risks Come In
A home provides a service the household consumes every day while also functioning as a leveraged asset. Mortgage principal repayment increases the owner’s equity if the property value is unchanged. Appreciation, when it occurs, applies to the full property value rather than only the down payment. A fixed-rate mortgage stabilizes principal and interest, although taxes, insurance, maintenance, and association dues can rise.
These benefits are significant but conditional. A 5% decline on a home bought with 5% down can eliminate the initial equity before selling costs. A forced sale can realize that loss even when long-run local prospects remain favorable. Repairs and insurance shocks can create financial stress without a fall in market value. Housing wealth is also less liquid than cash savings and concentrated in one property and local economy.
The Federal Reserve’s 2025 Survey of Consumer Finances, released in October 2026, provides updated context. Median net housing value among owners rose from $218,900 in 2022 to $230,000 in 2025, measured in 2025 dollars. The same report found that renters and younger families were among groups experiencing declines in median net worth. These are descriptive outcomes across different households, not proof that purchasing a home would cause every renter to become wealthier. [65]
Tax benefits also vary. A household’s filing status, deductions, debt, and eventual sale determine its treatment. Assuming that every dollar of mortgage interest creates a tax saving exaggerates the benefit for households that do not itemize or cannot deduct the full amount. This paper’s calculations omit tax advantages rather than assign a benefit that may not exist.
Renting or Buying? Look Beyond the Monthly Payment
The following calculation compares the same housing service over four holding periods. It gives the renter credit for investing the cash that the buyer uses for the down payment and closing costs. Each month, whichever household has the lower housing cost invests the difference. Both are assumed able to fund the higher of the two budgets. This equal-budget convention avoids comparing a saving owner with a renter who spends all available cash.
The purchase price is $450,000. The buyer pays 5% down and 2% in purchase closing costs, borrowing $427,500 for 30 years at 6.5%. Initial property taxes are 1.2% of price, insurance is $1,800 annually, and maintenance is 1% of the initial price. Taxes increase 2% a year; insurance and maintenance budgets increase 3%. Private mortgage insurance is modeled at 0.6% of the initial loan annually until the scheduled balance reaches 78% of the original value, assuming current payments. Actual PMI premiums and cancellation rules vary. [66]
The alternative rent starts at $2,400 per month and rises 3% annually. Investments earn an assumed 5% annual effective return. Sale costs are 5% of the eventual home value. No refinancing, taxes on investment returns, housing tax deductions, capital-gains taxes, moving costs, or special assessments are modeled. These assumptions are deliberately visible because changing them can change the answer. The rent is an illustration, not a verified local comparable.
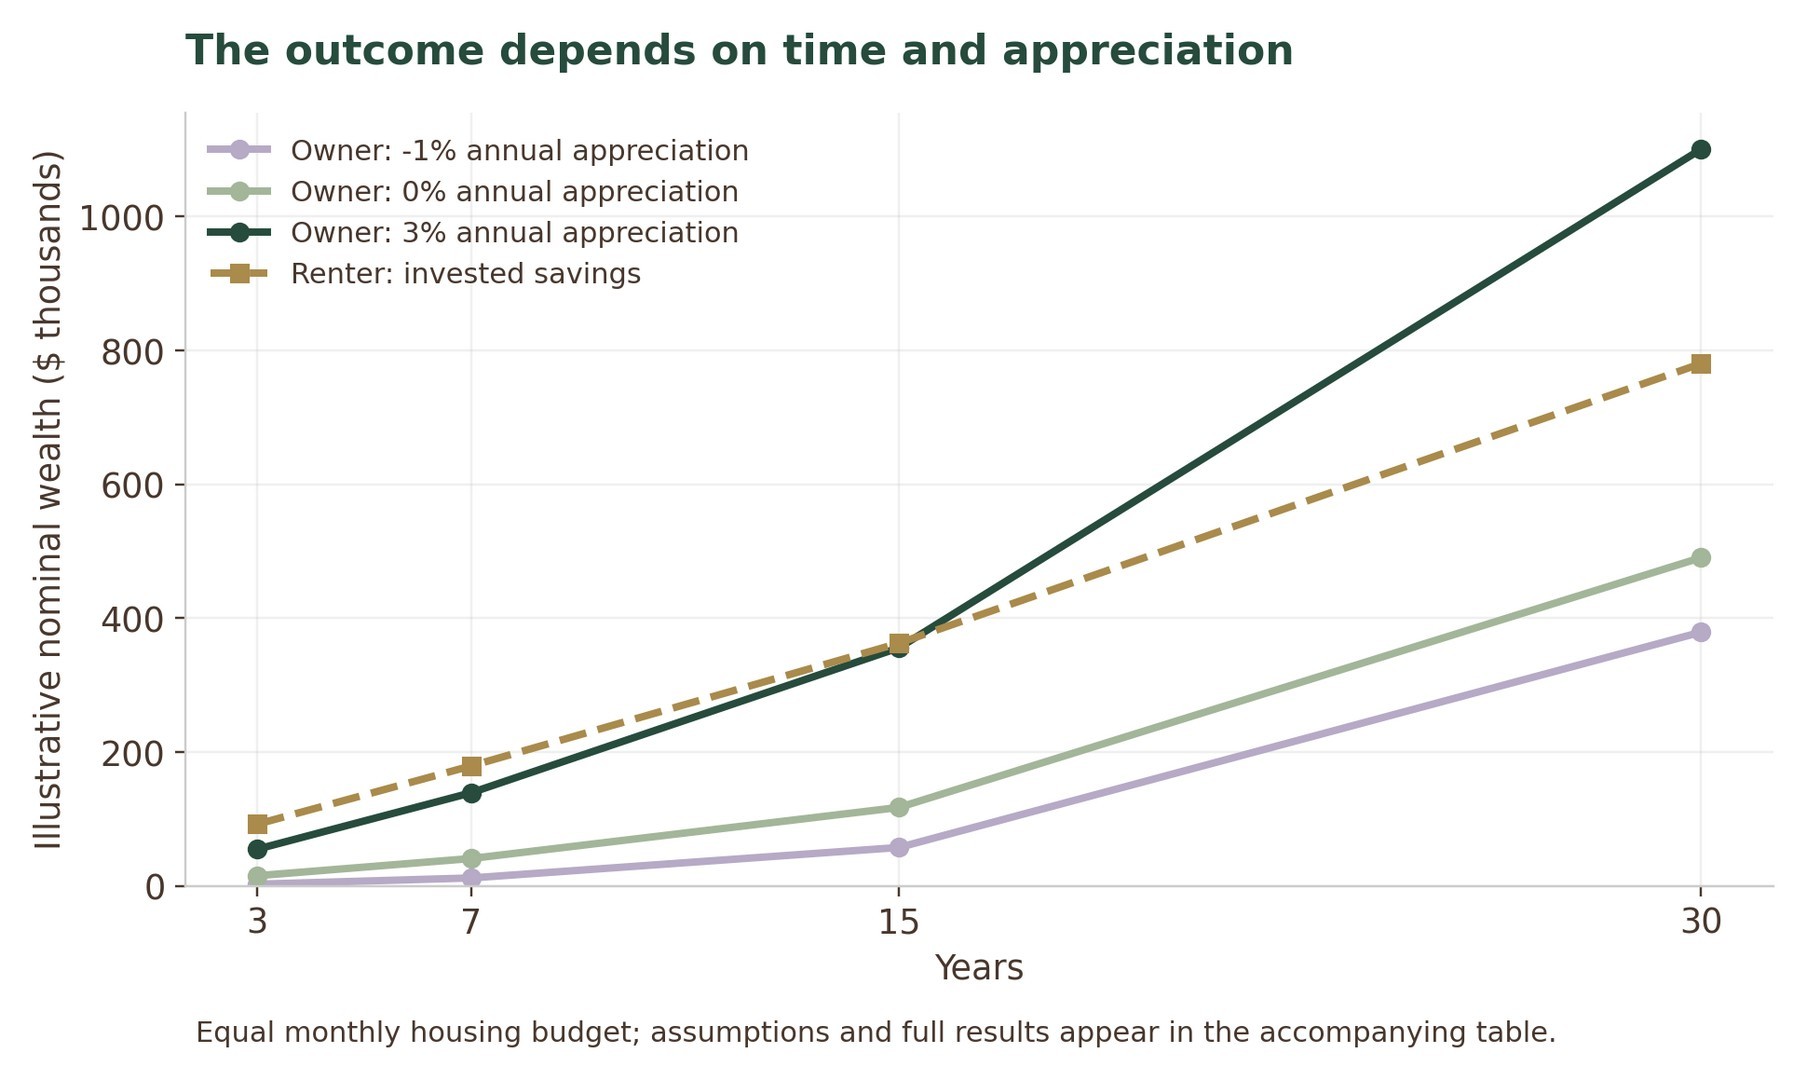 Select the figure for a larger view
Figure 27. Illustrative rent-versus-buy wealth paths. Assumptions are held consistent with the accompanying table; results are scenarios, not forecasts.
How Different Home-Value Assumptions Change the Comparison
| Years | Renter investments | Owner at -1% | Owner at 0% | Owner at 3% |
|---|---|---|---|---|
| 3 | $92k | $3k | $15k | $55k |
| 7 | $179k | $12k | $41k | $139k |
| 15 | $363k | $57k | $117k | $356k |
| 30 | $780k | $379k | $490k | $1,101k |
Illustrative nominal wealth, including owner net sale proceeds and any investments. All households receive the same monthly housing budget. Renter returns and owner appreciation are assumptions, not forecasts.
At 3% annual appreciation, renting and investing leads in this example at three and seven years, remains slightly ahead at fifteen years, and trails ownership at thirty years. With no appreciation, renting and investing leads at all four horizons. The result does not show that one tenure is universally superior. It shows why an ownership education program must address holding period, transaction costs, savings discipline, and downside scenarios.
The model also assumes reliable investment contributions and the ability to absorb rising expenses. Actual families may not save every monthly difference, and owners may face repair costs far above the maintenance allowance. Conversely, rents may rise faster or suitable rentals may offer less stability. A financially sound decision includes these nonfinancial conditions rather than treating one projected net-worth number as decisive.
Prefer the original layout? Open this section in the PDF →