
Chapter 11 of 12
Six Household Examples: What Makes Buying Possible?
Work through six illustrative households, overlapping policy changes, and financial stress tests.
Jump to a page on the report 1-59 + 37A-37C
The online edition groups several PDF pages into each chapter. Select a page to open its place in the web edition. Pages 1 and 2 correspond to the cover and contents on the research home page. The revised PDF adds Chapter 7 pages 37A-37C while retaining the original page numbers.
Meet the Six Examples and the Assumptions Behind Them
The following completed calculation applies common payment assumptions to six illustrative households. It demonstrates how reforms overlap; it is not a population estimate or a lender’s underwriting decision. Prices are deliberately chosen examples rather than current county medians or lower-quartile listing prices. Case B uses an income equal to Placer’s current four-person HOME/CDBG limit, but no case is represented as program-approved.
All cases begin with 5% down, a 30-year fixed mortgage at 6.5%, taxes at 1.2% of price annually, $150 monthly insurance, no HOA dues, and $400 in other monthly debt. Mortgage insurance is assumed to cost 0.6% of the initial first-mortgage balance annually when first-lien LTV exceeds 80%, and zero otherwise. The insurance rate is a modeling input, not an insurer quote. Actual subordinate financing, credit score, coverage, lender overlays, and property characteristics may change eligibility or pricing.
A case passes the illustrative payment screen if housing expenses do not exceed 36% of gross income and total debt does not exceed 43%. These are research thresholds, not universal agency limits. The model assumes enough savings for 5% down, 2% closing costs, and at least three months of housing expenses. Assistance is a hypothetical $100,000 deferred second with no current payment; it reduces the first mortgage and remains repayable. It is not a promise of an available program or a grant.
The model tests a 10% lower price, a half-point lower rate, assistance alone, and $30,000 in additional qualifying family income with no additional debt. The combined scenario applies all four. A price reduction represents access to a cheaper comparable housing option, not a forecast that a policy will reduce market prices by 10%.
Where the Six Households Start
| Case | Annual income | Price | Housing per month | Housing ratio |
|---|---|---|---|---|
| A | $84,000 | $400,000 | $3,142 | 44.9% |
| B | $105,100 | $450,000 | $3,516 | 40.1% |
| C | $150,000 | $550,000 | $4,264 | 34.1% |
| D | $150,000 | $650,000 | $5,012 | 40.1% |
| E | $200,000 | $800,000 | $6,134 | 36.8% |
| F | $210,000 | $1,000,000 | $7,630 | 43.6% |
Illustrative cases. The payment screen is housing at most 36% and total debt at most 43%; this is not lender or program approval.
 Select the figure for a larger view
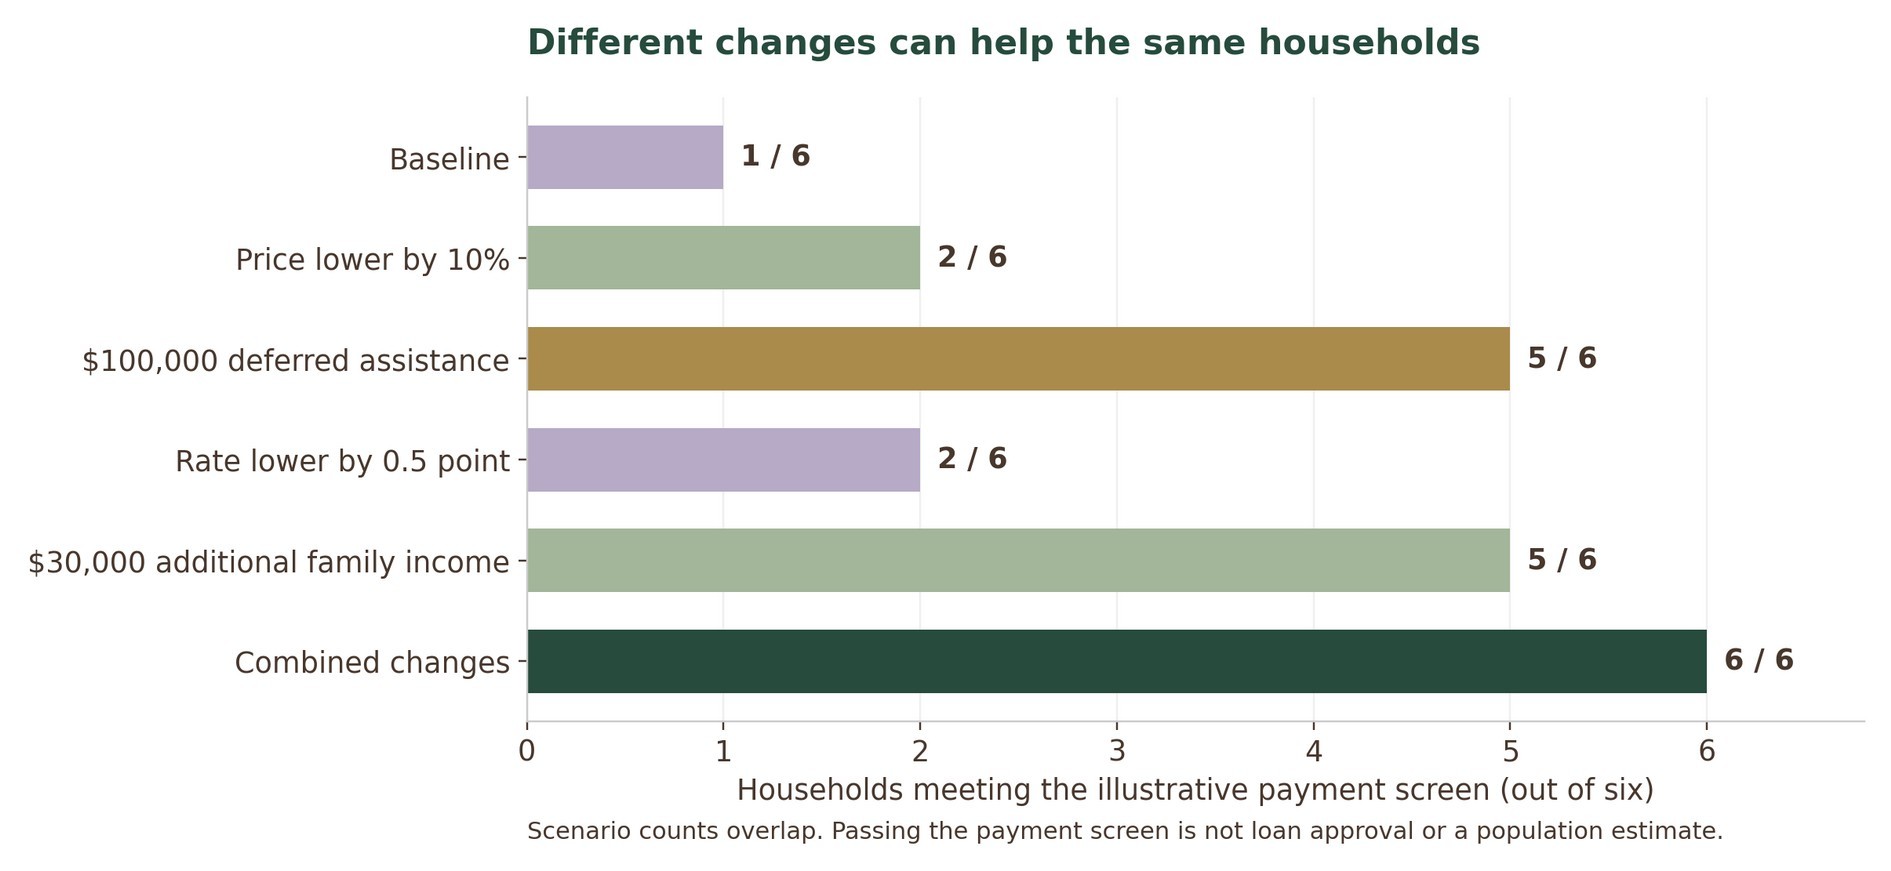
Figure 31. Six illustrative household cases under separate and combined changes. The groups overlap, so the scenario gains cannot be added.
How Different Changes Help the Same Households
| Case | Baseline | Price -10% | DPA 100k | Rate 6.0% | Income +30k | Combined |
|---|---|---|---|---|---|---|
| A | Above | Above | Pass | Above | Pass | Pass |
| B | Above | Above | Pass | Above | Pass | Pass |
| C | Pass | Pass | Pass | Pass | Pass | Pass |
| D | Above | Above | Pass | Above | Pass | Pass |
| E | Above | Pass | Pass | Pass | Pass | Pass |
| F | Above | Above | Above | Above | Above | Pass |
| Passing | 1 / 6 | 2 / 6 | 5 / 6 | 2 / 6 | 5 / 6 | 6 / 6 |
Pass means within the illustrative payment screen. Above means at least one ratio exceeds it. Cash, credit, program availability and property eligibility still require separate verification.
What Changed When the Numbers Changed
Only one of the six cases passes the baseline screen. A lower price or half-point rate reduction raises that number to two. Assistance alone brings five cases within the screen, as does added family income. Combining the changes brings all six within it. The result is five additional passing cases relative to baseline, not the sum of each separate scenario’s gains.
The same mechanism can help one household but leave another constrained. Case F still exceeds the housing ratio after assistance alone or family income alone; it passes the combined scenario. Case C already passes and should not be counted as newly enabled by every reform that improves its payment.
These results cannot establish that assistance is always more effective than rate changes. The subsidy amounts are not cost-equivalent, prices and incomes are selected illustrations, and added family income creates legal and personal obligations. The loan price needed for a half-point rate reduction is also unspecified. A cost-effectiveness comparison would divide the public cost by additional sustained purchases under comparable designs.
An Affordable Payment Still Needs a Financial Cushion
A household with 3% or 5% of the purchase price saved cannot fund the modeled 5% down payment plus 2% closing costs without another allowed source. At 10% savings, the examples leave 3% of the price after closing, sufficient for three months of the modeled baseline housing expense. A different reserve standard, higher insurance, or an HOA assessment could change that result.
The stress test reduces gross income by 10% and increases taxes and insurance by 10%, leaving the other assumptions unchanged. Among the cases that pass the baseline screen, Case C’s housing ratio rises from 34.1% to approximately 38.5%. Under the combined scenario, all six remain below 34% on that stressed housing ratio. These are conditional calculations; they do not include maintenance, loss of a whole co-borrower’s income, or an additional family debt.
A separate six-month reserve standard is materially stricter than the three-month standard. Approval and resilience should therefore be reported as separate outcomes. A household may qualify yet have too little liquidity for a major repair or temporary income loss.
Why Six Examples Can’t Speak for an Entire County
Estimating additional households in Sacramento, Placer, or Santa Clara requires representative household weights, verified local inventory, property-specific program limits, and actual rate and MI quotes. Credit scores cannot be translated into monthly payments with a generic conversion from agency points. Local assistance income limits cannot substitute for Fannie or Freddie AMI calculations.
Without those inputs, multiplying these six examples by county household counts would create false precision. The completed model instead establishes the calculation logic, identifies binding constraints, and demonstrates why combined policy gains must be deduplicated.
Prefer the original layout? Open this section in the PDF →