
Chapter 2 of 12
The Homes We Didn’t Build
Follow the construction recovery, the shortage of attainable ownership options, and the local delivery pipeline.
Jump to a page on the report 1-59 + 37A-37C
The online edition groups several PDF pages into each chapter. Select a page to open its place in the web edition. Pages 1 and 2 correspond to the cover and contents on the research home page. The revised PDF adds Chapter 7 pages 37A-37C while retaining the original page numbers.
How the Housing Crash Left a Lasting Shortage
 Select the figure for a larger view
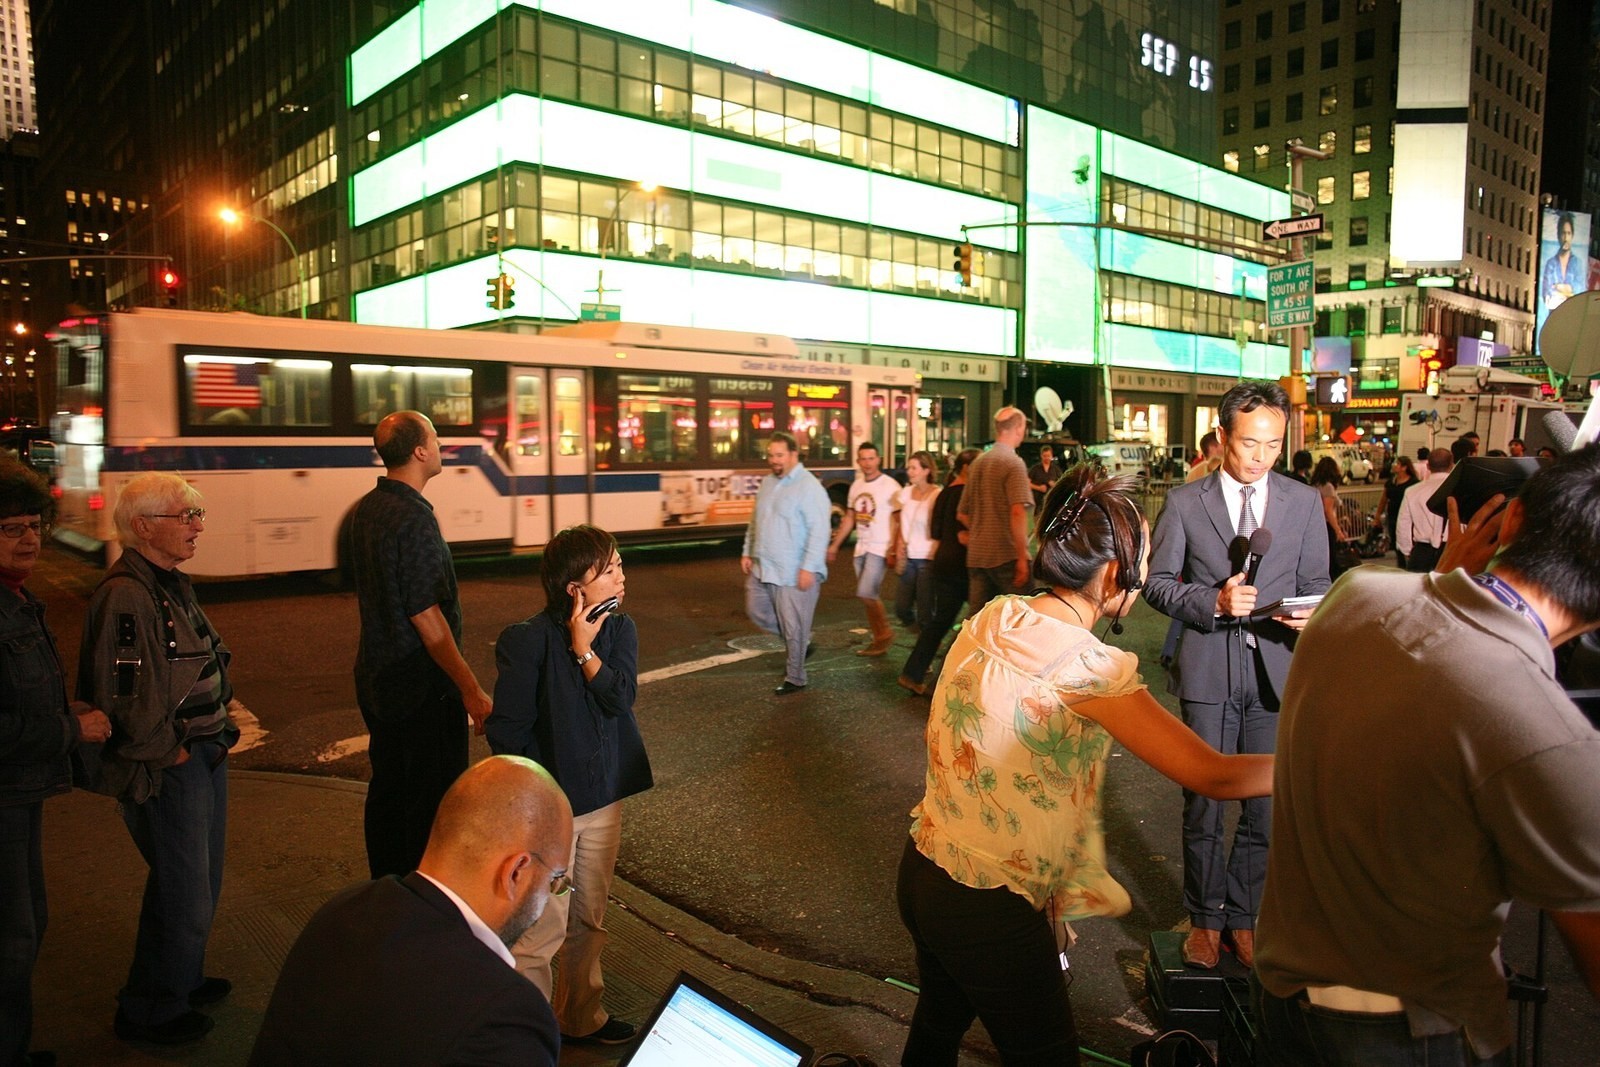
Figure 7. Outside Lehman Brothers headquarters in New York on September 15, 2008, the day the firm filed for bankruptcy.
The housing crash disrupted builders, lenders, construction workers, and households at the same time. Foreclosures and falling prices weakened household demand. Development financing contracted, builders lost capital, and workers left the industry. When demand recovered, the construction pipeline could not immediately replace the homes that had not been built.
The resulting shortage accumulated over time. Land, infrastructure, labor, insurance, financing costs, and approval delays now constrain production in different combinations across markets. A single national interest-rate decision cannot explain this history, and lower rates alone cannot resolve it.
Freddie Mac estimated a national shortage of approximately 3.7 million housing units in the third quarter of 2024. That estimate compares the existing stock with modeled housing demand, including demand that is not fully expressed in observed household formation. It is not a count of available lots or a forecast of immediate purchases. Its national estimate cannot be allocated to Sacramento, Placer, or Santa Clara by population share. [23]
 Select the figure for a larger view
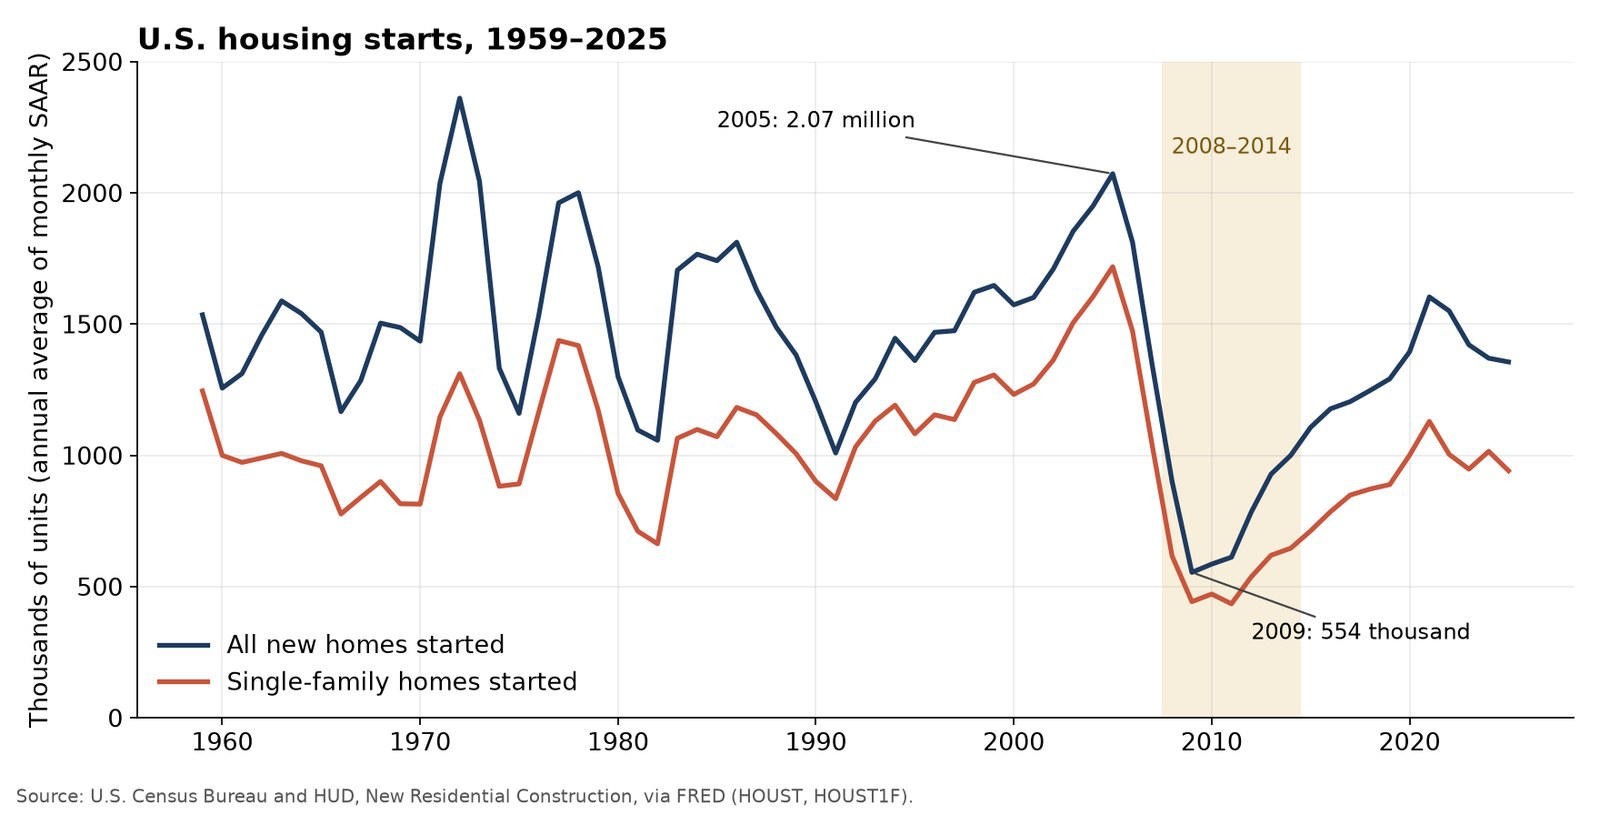
Figure 8. U.S. housing starts, 1959-2025. Starts fell from approximately 2.07 million in 2005 to 554,000 in 2009; the shaded period is 2008-2014. Starts are authorizations becoming construction, not completed units. The completed-unit exhibit below measures a different stage. [24]
The Slow Rebuilding After 2008
| Period | Starts per year | Completions per year | Household change |
|---|---|---|---|
| 2000-2007 | 1.738m | 1.716m | 1.239m |
| 2008-2014 | 0.766m | 0.778m | 0.730m |
| 2015-2019 | 1.206m | 1.124m | 1.278m |
| 2020-2025 | 1.446m | 1.430m | 1.676m |
Author calculations from Census series. Household change is a survey-estimate difference, not a shortage. The first row uses seven household changes and eight construction years. [24, 25]
The historical exhibit distinguishes construction from demand. Completions count privately owned housing units finished during a year. The household series counts occupied households at a survey reference date. Neither series alone measures the need to replace demolished homes, maintain a workable vacancy rate, accommodate second homes, or correct geographic mismatches. Appendix A provides the annual observations and their limitations. [24, 25]
A simple subtraction also misses suppressed household formation. Adults may remain with parents or roommates because they cannot afford a separate home. Observed household counts then understate potential demand. Conversely, the construction boom of 2005 and 2006 cannot serve as a permanent production target: parts of that boom were unsustainable.
 Select the figure for a larger view
 Select the figure for a larger view
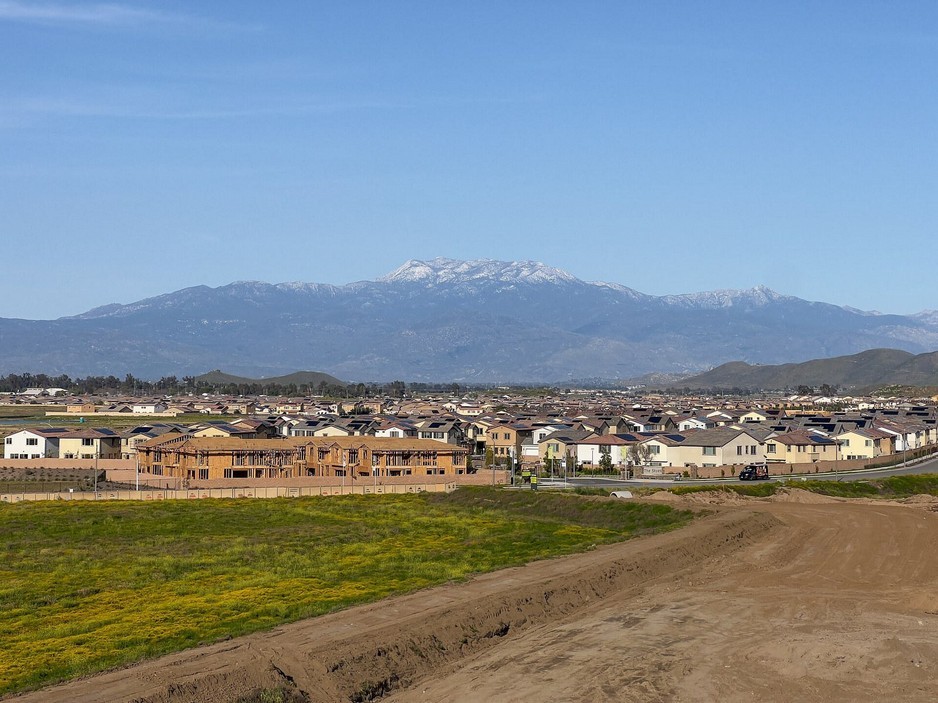
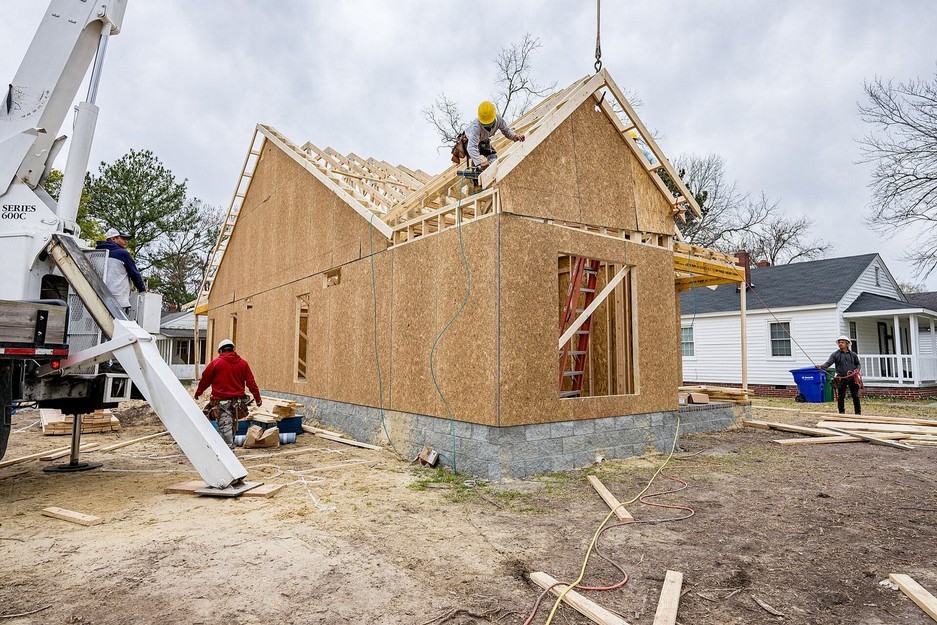
Figures 9 and 10. Left: Workers frame new houses at an affordable housing development in Greenville, North Carolina, February 2024. Right: New homes under construction in Winchester, Riverside County, California, April 2024.
Why Homes Within Reach Are So Hard to Find
The practical shortage is a mismatch between homes and purchasing power. Large or expensive homes can be profitable even where modest homes are scarce. Land, infrastructure, and development fees often impose substantial costs per dwelling regardless of its size. Builders may respond by producing a higher-priced home that can absorb those costs. Zoning can further restrict small lots, attached homes, condominiums, and other lower-cost forms of ownership.
An attainable-supply agenda therefore includes detached starter homes, townhomes, condominiums, manufactured homes, shared-equity ownership, and suitable small multifamily properties. Each has different financing and maintenance requirements. Condominium dues, reserve deficiencies, insurance costs, or project ineligibility can erase an apparent purchase-price advantage. An accessory dwelling unit can create rental housing or space for relatives without creating a separately purchasable home.
The appropriate measure is completed, financeable housing at prices consistent with local household incomes. Permit counts and zoning capacity describe earlier stages of that process. They are useful indicators, but they are not completed homes.
What California and Sacramento Have Been Building
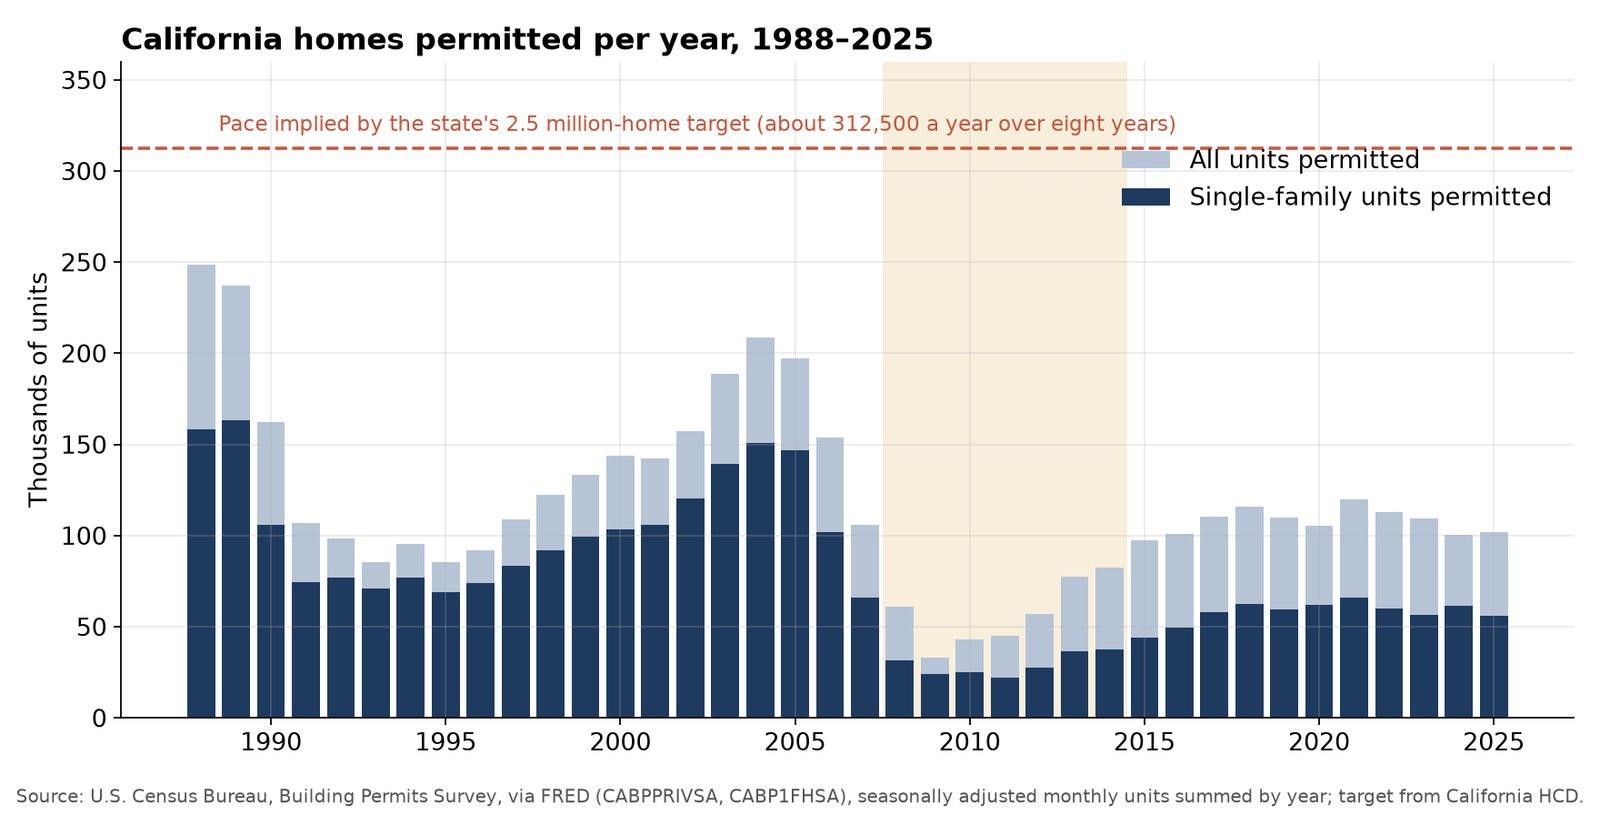
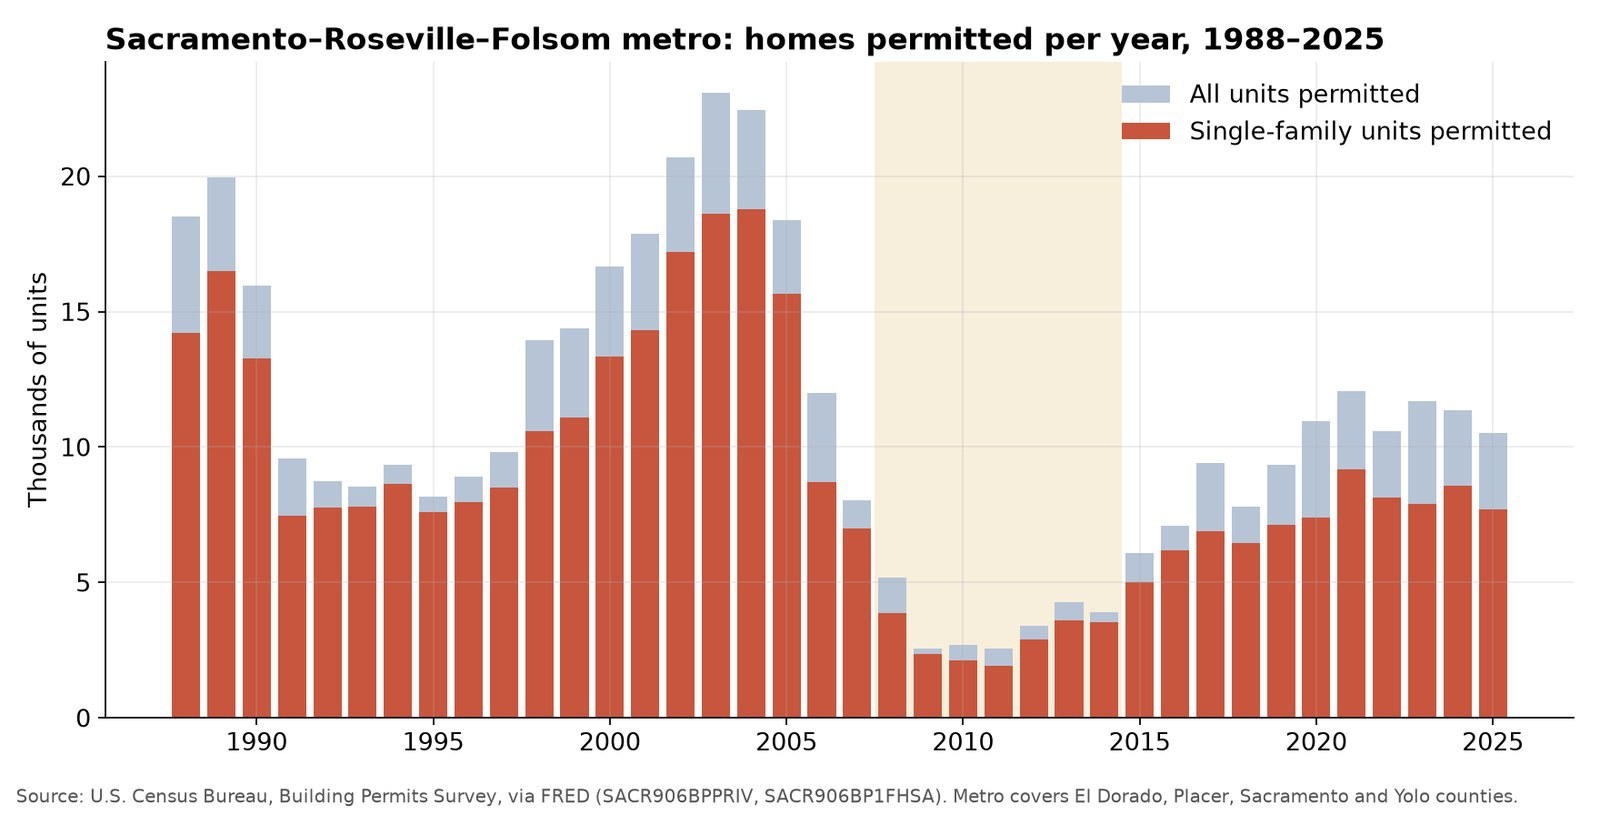
California’s permit record shows a steep post-crash contraction. The accompanying Census series tracks statewide and Sacramento metropolitan authorizations, rather than completed or occupied homes. The eight-year planning benchmark shown on the California chart comes from the state housing plan; it is not an annual construction forecast. Regional housing-element cycles do not all share identical dates. [26, 27]
 Select the figure for a larger view
Figure 11. California housing permits, 1988-2025. The source exhibit contrasts annual permitted units with an annualized benchmark derived from a 2.5-million-home planning target. The target is an annualized planning comparison. Housing-element cycle dates vary by region. Permits do not equal completions. [26, 27]
 Select the figure for a larger view
Figure 12. Homes permitted in the Sacramento-Roseville-Folsom metro area, 1988-2025. Approximately 23,000 were permitted in 2003, 2,550 in 2011, and 10,500 in 2025. Metropolitan geography includes El Dorado, Placer, Sacramento and Yolo counties. Permits do not equal completed homes. [26]
The 2015 Legislative Analyst’s Office report explains why local supply constraints can spread across nearby markets. It found high development costs and insufficient construction in expensive coastal areas, with inland markets absorbing some displaced demand. Its analysis found that a 10% increase in one county’s housing costs was associated with roughly a 5% increase in neighboring counties. These historical associations help explain regional pressure; they are not forecasts for Placer prices or current construction-cost estimates. [28]
 Select the figure for a larger view
Figure 13. Sacramento from the air, July 2023, with the downtown and midtown street grid at center.
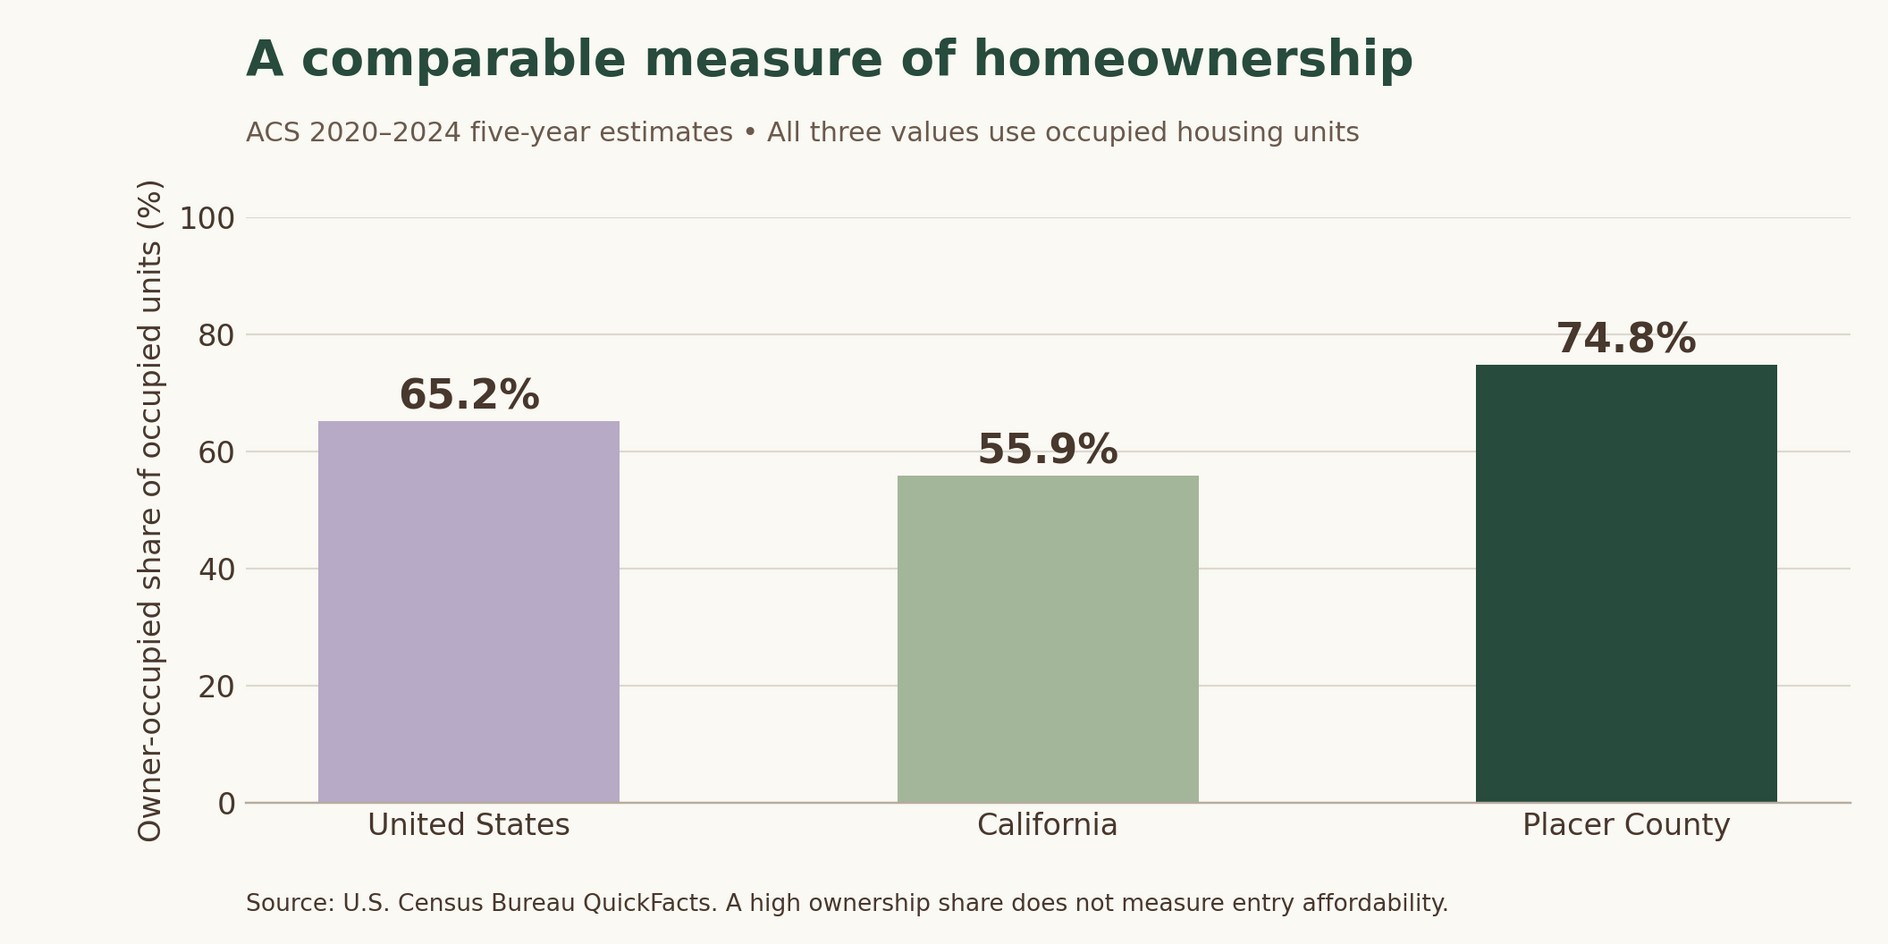
Census ACS estimates for 2020 through 2024 put the owner-occupied share of housing units at 74.8% in Placer County, 55.9% in California, and 65.2% nationally. Using the same measure and period avoids confusing the proportion of people living in owner-occupied homes with the proportion of households that own. High existing ownership does not establish that new buyers can afford entry. [29, 30, 31]
 Select the figure for a larger view
Figure 14. Owner-occupied housing units in the United States, California and Placer County, ACS 2020-2024. All three bars use the same household measure and period. Matching ACS 2020-2024 estimates. [29, 30, 31]
From a Permit to a Finished Home: Know What’s Being Counted
California HCD’s annual progress reporting distinguishes applications, entitlements, permits, and certificates of occupancy or other readiness indicators. Those stages describe different accomplishments. They are reported by local jurisdictions and can be revised. A permit can authorize construction without producing an occupied unit in the same year. [32]
Local progress also needs a tenure distinction. A completed income-restricted apartment can improve rental stability without producing a first-time homeowner. An ADU can create valuable housing without a separate sale. An affordable ownership unit may carry resale restrictions that preserve affordability but limit the first owner’s appreciation. None should be judged against a purpose it was not designed to serve.
Homes Permitted and Ready for Use, by Income Group
| Area year and stage | Very low or below | Low | Moderate | Above moderate | Total |
|---|---|---|---|---|---|
| CA 2024 permits | 8,697 | 14,678 | 8,999 | 84,170 | 116,544 |
| CA 2025 permits | 12,139 | 16,818 | 9,607 | 85,032 | 123,596 |
| CA 2024 readiness | 9,172 | 11,492 | 9,049 | 82,161 | 111,874 |
| CA 2025 readiness | 10,738 | 13,478 | 8,202 | 79,812 | 112,230 |
| Roseville 2024 permits | 219 | 273 | 464 | 577 | 1,533 |
| Roseville 2025 permits | 129 | 363 | 369 | 573 | 1,434 |
| Roseville 2024 readiness | 18 | 125 | 450 | 705 | 1,298 |
| Roseville 2025 readiness | 332 | 459 | 493 | 775 | 2,059 |
| Placer 2024 permits | 14 | 62 | 91 | 670 | 837 |
| Placer 2025 permits | 22 | 40 | 59 | 431 | 552 |
| Placer 2024 readiness | 14 | 63 | 82 | 746 | 905 |
| Placer 2025 readiness | 0 | 37 | 46 | 522 | 605 |
Placer means unincorporated Placer only. Author calculations from HCD October 30, 2026 export using stage-year matching and exact-row deduplication. Readiness includes certificates of occupancy or other evidence, not necessarily occupancy or closed purchases. [32]
Roseville’s reported permits declined from 1,533 units in 2024 to 1,434 in 2025, while units reaching certificate-of-occupancy or other readiness stage increased from 1,298 to 2,059. Those events belong to different development cohorts; dividing the second count by the first would not measure a completion rate. The official calendar-year observations also do not validate the earlier third-party rolling-year claim of 744 permits.
For unincorporated Placer, the October HCD export reports 552 permits in 2025. The county’s March 2026 progress report states 574, including 22 more very-low-income units. The cause of that difference is unresolved. This table uses one export consistently rather than silently combining versions. Neither series represents the whole of Placer County. [32, 33]
The state total is an author calculation from the same file and cleaning rules, not a quoted audited HCD headline. The 2025 income groups show why an overall production count cannot stand in for lower-income access. Even the affordable units in these tables combine tenures and do not establish how many first-time buyers completed purchases.
 Select the figure for a larger view
Figure 15. The California State Capitol in Sacramento at blue hour, August 2018.
A Funding Approval Is Only the Beginning
The CalHFA Mixed-Income Program’s project list supplies concrete examples of the state’s affordable housing pipeline. Its developments are rental housing, not an inventory of homes available for purchase. The approvals identify financing milestones rather than verified completion and occupancy dates. [34]
Rental Developments With Financing Approval
| Project and county | Units | Approval date | Status supported by record |
|---|---|---|---|
| Monarch / Sacramento | 241 | Mar. 20, 2025 | Financing approved; May 2025 groundbreaking |
| Sierra Vista / Placer | 192 | May 21, 2026 | Financing approved; completion projected May 2028 |
| Julian Street Studios / Santa Clara | 305 | May 22, 2025 | Financing approved; completion projected Aug. 2027 |
| North City Affordable / San Diego | 224 | Feb. 20, 2025 | Financing approved; completion projected Mar. 2027 |
| Sherman / Los Angeles | 244 | Apr. 16, 2026 | Final financing commitment |
| Victoria Flats / Ventura | 104 | Apr. 16, 2026 | Final financing commitment |
| Marinwood Plaza / Marin | 125 | Apr. 16, 2026 | Final financing commitment |
| 831 Water Street / Santa Cruz | 150 | Oct. 16, 2025 | Final financing commitment |
All are multifamily rentals. Approval dates and units come from CalHFA’s project list and reports; projected completion is not observed delivery. Monarch groundbreaking is confirmed by its developer. [34, 87]
A useful housing delivery report ties each project’s approved units and affordability restrictions to its later construction, occupancy, and operating status. It records tenure, AMI bands, subsidy, and the relevant date. For ownership developments, it also records actual sale prices and closed purchases. For rentals, it measures rents, occupancy, and continued affordability.
Judge Each Program by What It Is Meant to Deliver
Low-income housing tax credits and mixed-income financing primarily support rental supply. Zoning and permit reform expand development capacity, with outcomes depending on financing and market conditions. Fee deferral reduces carrying costs but may not lower the eventual price. Community land trusts preserve affordability through ground-lease and resale structures while limiting some owner appreciation.
Down payment assistance acts closer to a purchase but usually reallocates purchasing capacity across an existing supply of homes. If many buyers receive more purchasing power while inventory remains fixed, part of the benefit may raise bids and flow to sellers. Pairing assistance with attainable supply reduces that risk, although the size of the effect varies by market.
The common evaluation standard is additional, completed, durable housing outcomes per public dollar. Rental security and ownership access are both valuable, but their results should be reported separately.
Prefer the original layout? Open this section in the PDF →